On-base Percentage
From SABR Encyclopedia
In baseball statistics, on-base percentage (OBP) (sometimes referred to as on-base average [OBA], as the statistic is rarely presented as a true percentage) is a measure of how often a batter reaches base on his own merit. OBP first became an official MLB statistic in 1984 after evolving from similar concepts that were unofficial. Examples of a batter not reaching base on his own merit are a fielding error, fielder's choice, dropped third strike, fielder's obstruction, or catcher's interference (the latter two are ignored as either times-on-base (TOB) or plate appearances in calculating OBP). OBP is added to slugging average to determine on-base plus slugging (OPS). Players qualify for the league OBP championship in exactly the same was as the batting (batting average) championship from rule 10.22(a) of the 2009 Official Rules[1].
Contents |
[edit] Overview
Traditionally, the best leadoff hitters in the game have high on-base percentages. The league average for on-base percentage has varied considerably over time; in the modern era it is around .340, whereas it was typically only .300 in the dead-ball era. On-base percentage can also vary quite considerably from player to player. The record for the highest career OBP by a hitter, based on over 3000 plate appearances, is .482 by Ted Williams. The lowest is by Bill Bergen, who had an OBP of .194.
Though extremely unlikely, it is possible for a player's on-base percentage to be lower than his batting average (H/AB). However very few players in major league history fall into this category, with the majority of them having under 100 ABs, as it requires having almost no walks or times hit by pitch, with a relatively higher number of sacrifice flies (e.g. if a player has 2 hits in 6 at bats with a sacrifice fly, his batting average would be .333, but his on-base percentage would be .286). An example of this phenomenon would be the Hall-of-Fame pitcher Phil Niekro's hitting statistics from 1982. In 87 AB he never walked nor was hit by a pitch, but had 17 hits, 3 sacrifice hits, and 1 sacrifice fly, leading to a Batting Average of .195 (17/87) and an OBP of .193 (17/88).
On-base percentage is calculated using this formula from rule 10.21(f) of the 2009 Official Rules[2]:
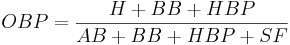
where
- H = Hits
- BB = Bases on Balls (Walks)
- HBP = times Hit By a Pitch
- AB = At bats
- SF = Sacrifice Flies
NOTE: Sacrifice flies were not counted as an official statistic until 1954. Before that time, all sacrifices were counted as sacrifice hits (SH), which included both sacrifice flies and bunts. Bunts (sacrifice hits since 1954), which would lower a batter's on-base percentage, are not included in the calculation for on-base percentage, as bunting is an offensive strategy – often dictated by the manager – the use of which does not necessarily reflect on the batter's ability and should not be used to penalize him. For calculations of OBP before 1954, or where sacrifice flies are not explicitly listed, the number of sacrifice flies should be assumed to be zero. Indeed, there have been periods (most recently 1940-1953) where batters were charged with an at bat that after 1953 would have been a sacrifice fly. In those periods, the sacrifice statistic is a count of sacrifice bunts only.
[edit] Leaders
[edit] All-time leaders
bold is active player
[edit] Single-season leaders
| # | Player | OBP[4] | Team | Year(s) |
| 1 | Barry Bonds | .609 | San Francisco Giants | 2004 |
| 2 | Barry Bonds | .582 | San Francisco Giants | 2002 |
| 3 | Ted Williams | .551 | Boston Red Sox | 1941 |
| 4 | Babe Ruth | .542 | New York Yankees | 1923 |
| 5 | Barry Bonds | .529 | San Francisco Giants | 2003 |
| 6 | Babe Ruth | .528 | New York Yankees | 1920 |
| 7 | Ted Williams | .526 | Boston Red Sox | 1957 |
| 8 | Billy Hamilton | .517 | Philadelphia Phillies | 1894 |
| 9 | Barry Bonds | .515 | San Francisco Giants | 2001 |
| 10 | Ted Williams | .512 | Boston Red Sox | 1954 |
Footnotes
- ↑ http://mlb.mlb.com/mlb/downloads/y2008/official_rules/10_the_official_scorer.pdf, retrieved on 2009-10-21.
- ↑ http://mlb.mlb.com/mlb/downloads/y2008/official_rules/10_the_official_scorer.pdf, retrieved on 2009-10-21.
- ↑ Template:Cite web
- ↑ Template:Cite web
